Fig 1. Scheme
This little note grew out of a back-and-forth argument on uk.rec.waterways. It started when I referred to my 18-year old note about water usage of locks, which was mainly about locks with side ponds, and how the efficiency of locks as mechanical machines varied between simple locks, complex locks and boat lifts. That note implies that a lock working boats up and nothing down uses a little more water than a lock cycled empty, and a little less when boats are coming down but not up. I reached that conclusion by considering the energy balance of locks with side ponds, which appear not to comply with conservation of energy beyond a certain number of side ponds unless that variation with direction happens. It is difficult to see immediately how this occurs, and the argument in the note cited, taking an alebraic sum of the flows past a reference surface, did not convince.
This is an attempt to make it clearer by following each piece of water through the processes.
There was a side argument about the movement of water in the pounds between the locks.
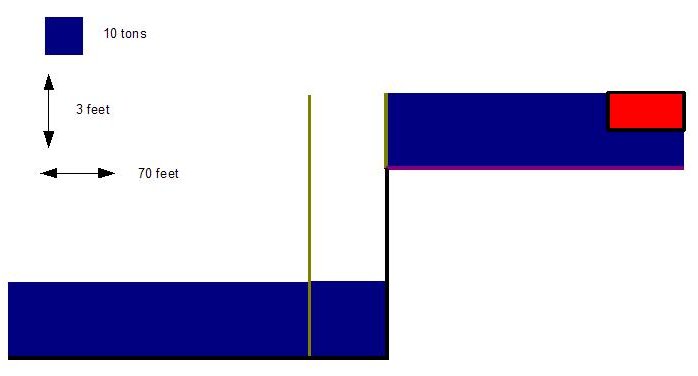
As canal boats and locks are long and thin it is awkward to draw them to scale, so I have stretched the vertical scale by about 25 times. I have drawn the pounds at 3 ft deep, the lock at 72 foot long and the drop in level as 7 ft. With those figures the lock takes near enough 100 tons to go from empty to full. The blue square top left, which is the side view of a piece of water 1 ft 6 in by 36 ft by 7 ft represents roughly 10 tons of water.
Fig 1. Scheme
The boat is drawn as 2 squares, that is 1 ft 6 in deep by 72 ft long by 7 ft wide, at which it is displacing 20 tons. I have drawn only the part of the boat that is in the water, you will have to imagine the cabin on top.
I have assumed the top and bottom approaches to the lock are the same width as the lock. This would be unusual but it allows the same amount of water to have the same area everywhere on the diagram. It does not affect the outcome.
In the diagrams below, interesting parcels of water are coloured so that they can more easily described.
Let's watch what happens with an empty lock first to get the hang of the diagrams. We start with the lock empty (Fig 2).
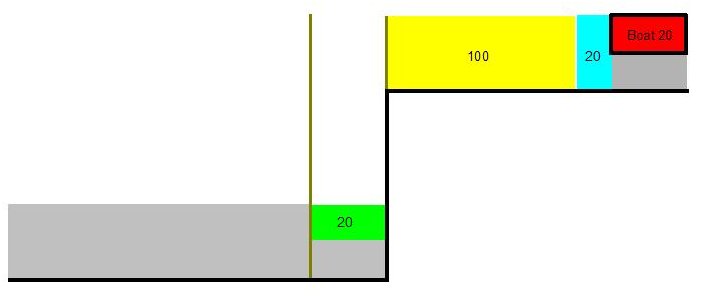
Fig 2. Starting condition
At the top, behind the top gate, I have marked 100 tons of water in yellow. Next along the top level is another parcel of 20 tons coloured blue which we will need to watch later. Everything after that is coloured grey as we shall not need it yet.
Now let's fill the lock. It takes 100 tons to fill it, so we open the paddles and let that 100 tons in yellow fall into the lock (Fig 3). As that water flows in, the rest of the water on the top level moves right to left by 100 tons, taking water off the pound above and ultimately from the lock above.
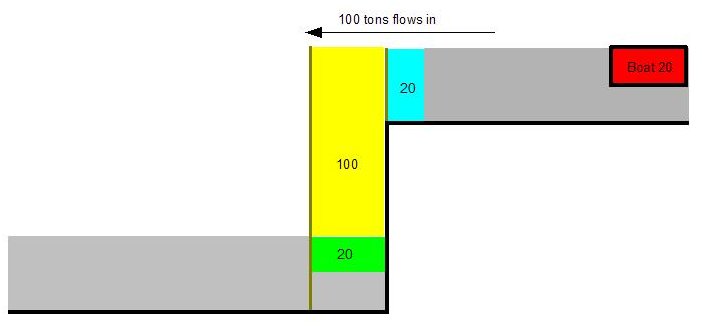
Fig 3. Filling the lock
Then we empty it again (Fig 4). We open the bottom paddles and 100 tons leaves the lock to bring the level down to where we started. That 100 tons, coloured yellow, is now in the pound below and pushes all of the water in that pound 100 tons towards the next lock down.
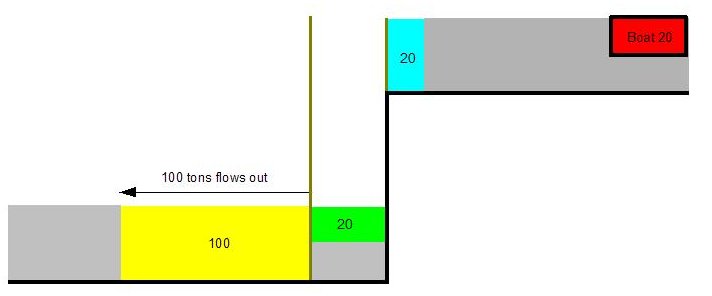
Fig 4. Emptying the lock
The lock is now back where it started, and it's clear that 100 tons of water has left the top level and appeared at the bottom, that yellow bit.
Now let's look at what happens when there's a boat in the lock. This next cycle is not something that would be done in practice, but I've included it because people often mistakenly think that the presence of a boat in a lock affects the amount of water used. We shall cycle the lock with a boat in it that stays in the whole time.
We start as in Fig 5. The boat is floating at the lower level of the lock. Note that it displaces 20 tons, so I've had to shift the green bit out of the lock to make way for it but that's not part of the story yet.
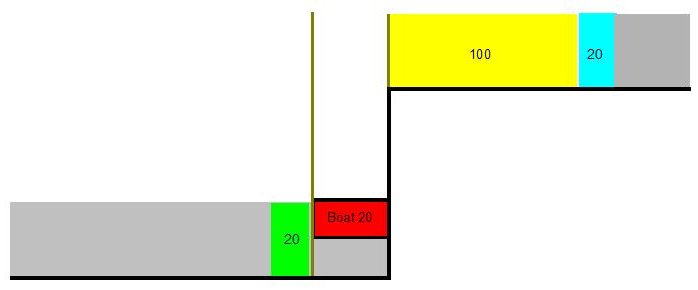
Fig 5. Starting position
Now we bring the boat up to the top level by adding water at the top. We can see immediately from the diagram that the yellow 100 tons will just do the job, Fig 6.
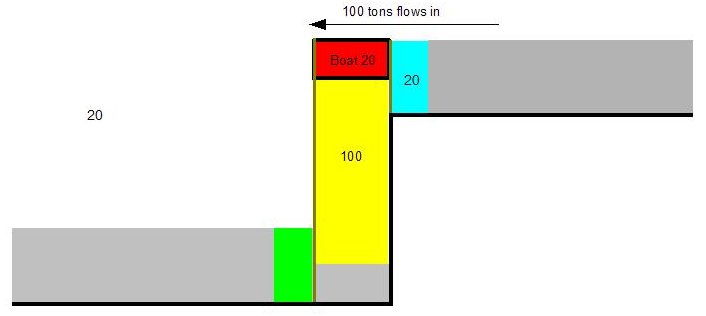
Fig 6. Filling the lock
And then we empty the lock again, to get back to where we started, Fig 7. We can see that, just as with the empty lock, 100 tons has left the top level and gone to the bottom, all of the yellow bit. It makes no difference what is floating in the lock, it always takes 100 tons to fill it and it always takes 100 tons run out at the bottom to empty it. That's not what this note is about.
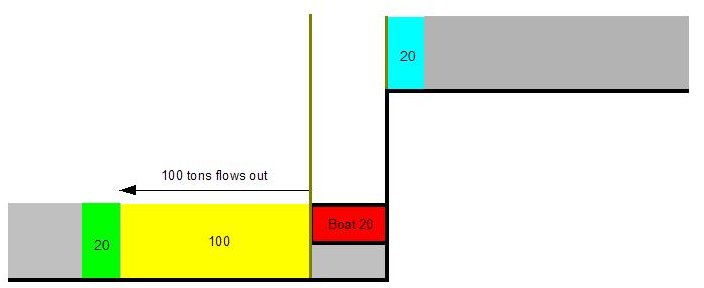
Fig 7. Emptying the lock
This is also the cycle when boats go up and down alternately. At the top, we could just swap one boat for another with no change in the position of the water, and again at the bottom swap that one for yet another. Assuming all the boats are the same size, the water used is 100 tons per cycle.
Now let's see what happens when the boats are all going the same way.
First let's look at a boat going down but nothing wanting to come up. We start from the same state as before, with the lock empty (Fig 8).
Fig 8. Starting condition, waiting to go down
In the same way as before, we fill the lock by running in 100 tons, again that's the yellow bit (Fig 9).
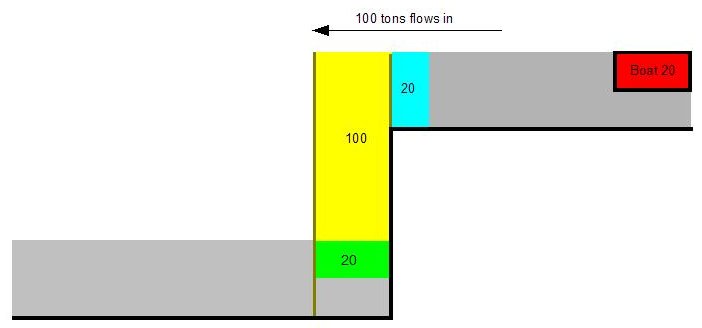
Fig 9. Filling the lock
Then we open the top gate and move the boat into the lock. Now the boat displaces 20 tons, so it cannot just fit into the lock chamber, which is already full. As the boat goes in, 20 tons comes out of the lock (flowing around and under the boat) to make room for it (Fig 10).
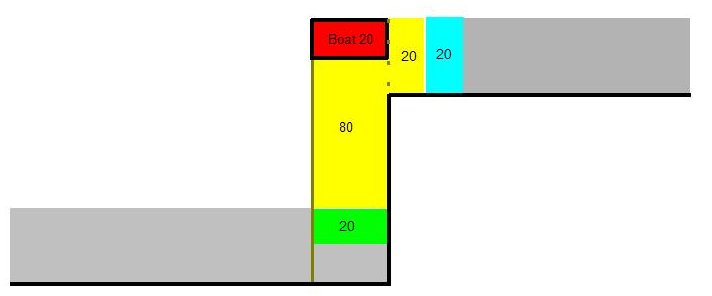
Fig 10. Going into the lock
We can see that now 20 tons of the yellow that just a moment ago flowed into the lock to fill it has now come back out and is now above the top gate again, and all of the water between where the boat was in Fig 8 and where the boat is now has moved to the right by 20 tons.
We now close the top gate and empty the lock (Fig 11).
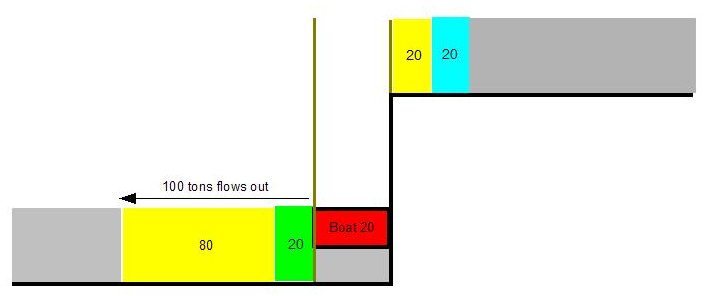
Fig 11. Emptying the lock
To bring the level down from the upper to the lower we know we need to drain 100 tons out of the lock chamber, this can be seen in the figure. The 100 tons that comes out is 80 tons of the yellow and 20 tons of green.
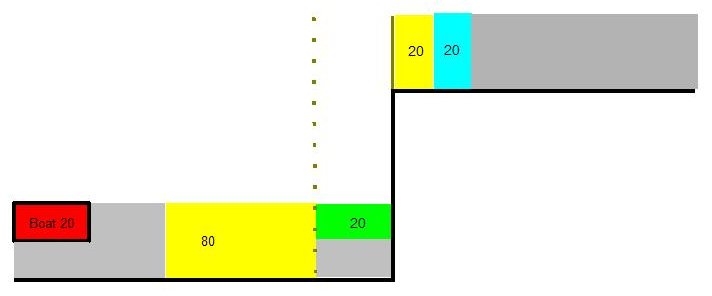
Fig 12. Leaving the lock
When the boat is at the bottom, the bottom gates are opened and the boat moves out. When it does that, 20 tons of water goes to the right to replace the water the boat was displacing, let that be the green bit as shown.
Now if we compare Fig 8, where we started, with Fig 12, where we are now, we see that the lock is back as it was, empty, but only 80 tons has moved from the top to the bottom, part of the yellow. How come? Where has the 100 tons we let out gone?
If we look at the 100 tons that we let out of the lock to bring the boat down, we see that it was 80 tons of yellow and 20 tons of green. But looking at Fig 8 we see that the green was already on the bottom level before we started.
What's happening? As the boat comes down it has to displace 20 tons of the lower level. If you remember back in Fig 5, when we cycled the lock up and down with a boat in it, we lifted the green out to make way for the boat before we started. Here, when the boat gets to the bottom, it pushes the green bit of water out through the paddles. But that green bit did not come down from the top paddles in this cycle, it was already down.
Also, at the top, we have seen already that of the 100 tons we put in through the paddles to fill the lock, 20 tons came back out again when the boat went in and that 20 tons, the small yellow bit, stayed up at the top level.
So boat going down, nothing going up, each lock fill and empty operation takes 100 tons through the paddles, but with the extra water movements driven by the boat's movement through the water, 80 tons net comes down.
The story for a boat going up but nothing coming down is different. We start from the same position, with the lock empty (Fig 13).
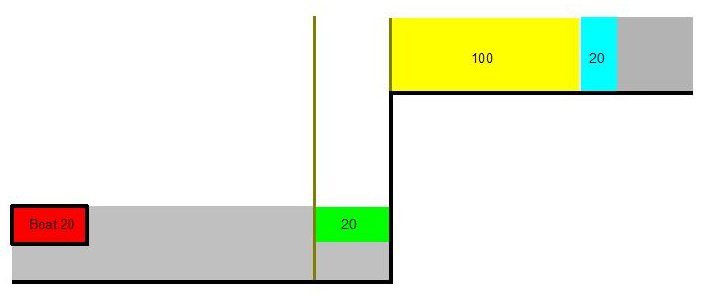
Fig 13. Starting condition, waiting to go up
We open the bottom gate and move the boat into the lock. It displaces 20 tons of water, the green bit here, which moves out beyond the bottom gate (Fig 14).
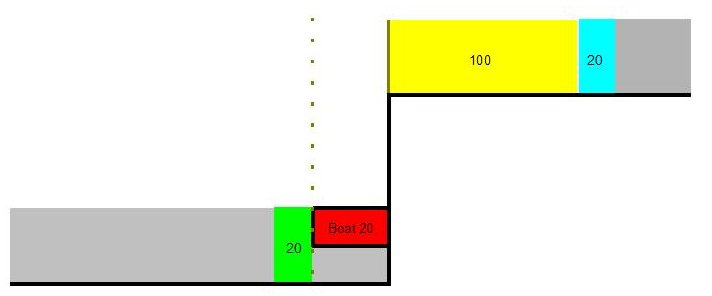
Fig 14. Going into the lock
The gate is then closed and the boat raised to the top level. As ever, this takes 100 tons taken from the top level; this is the yellow bit (Fig 15).
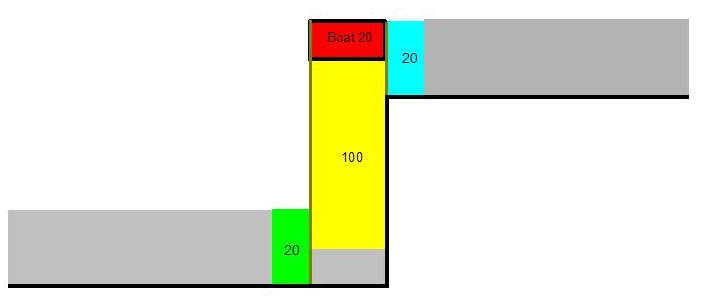
Fig 15. Filling the lock
The boat then leaves the lock and is replaced by another 20 tons from the top level. This is the blue bit, which is now in the lock (Fig 16).
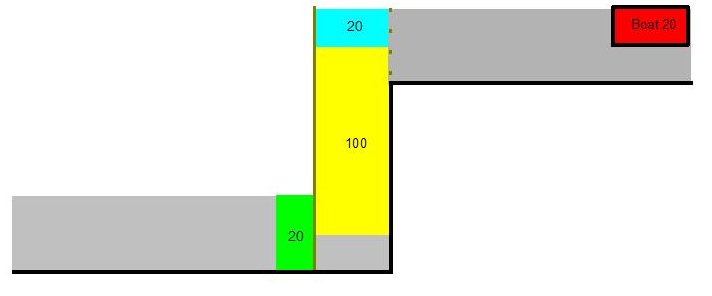
Fig 16. Leaving the lock
To get back to the same state as we started and complete the cycle ready for the next boat going up, we have to run 100 tons out of the lock, we take this to be the yellow bit (Fig 17).
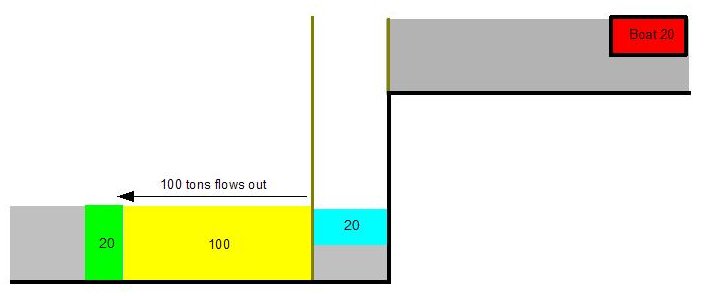
Fig 17. Emptying the lock
We are now back where we started. Comparing Fig 13 with Fig 17 we can see that there are 120 tons more on at the bottom than before we started. We have lost the 100 tons of yellow and the 20 tons of blue from the top, and gained 100 tons of yellow and 20 tons of green at the bottom.
So: A stream of ascending boats uses 120 tons per cycle; A stream of descending boats uses 80 tons per cycle; A alternating stream takes 100 tons per cycle.
Points to cover:
The locks "magically" moves both boat and hole, so in descending boat plus holes goes down, no boat plus no hole goes up; a hole is -20 tons.
Energy balance.
Flow in the pounds above and below as calculated in discussion.
How a lock can "lift" water while every particle goes downwards (water in a thin shell boat).
Balance in real life cf leakage, overflow.
How to measure.
Visible and invisible flows.
